
ResponseTime Monitor for google chrome
By Patrick Brunner
No Rating Available.
ResponseTime Monitor for google chrome
Screenshots:

ResponseTime Monitor for google chrome Mode Free Download
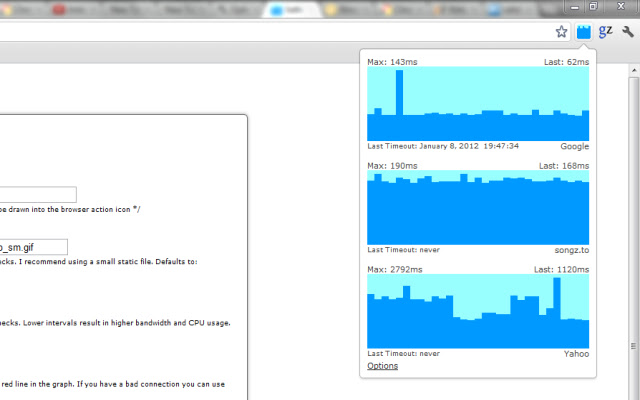
Shows the response times of up to three webservers. Useful to see how the internet/server connection performs.
What can I do with this extension?
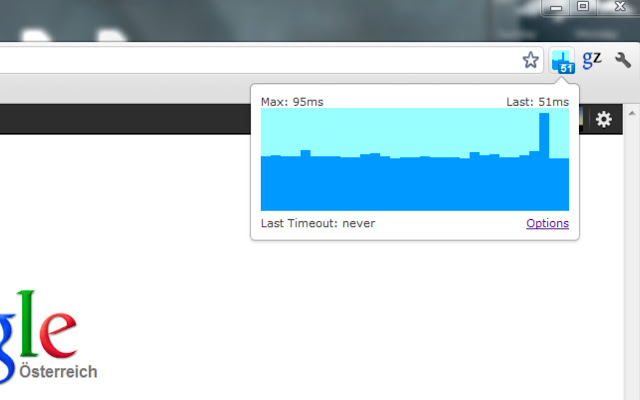
Basically this extension shows you the response time of a webserver and draws a nice chart.
What can I do with this information?
You can see how your internet connection performs or how fast your own webserver responds.
What does the chart show?
It shows the last 31 response times. Higher bars mean higher response times. If the request timed out it shows a red bar.
How can I interpret these response times?
If the bars are about the same height it is a sign for a healthy internet connection/server load. If there are red lines and blue lines mixed up or the chart is very volatile your internet connection is unstable or the server is overloaded. If it shows only red something is terribly wrong …
Why does this need permission to “Your data on all websites”?
To perform checks to a user specific URL it is required that the extension can send requests to ‘all websites’.
Author Details

Technical Information
| Package Name: | bjgaobjkcmihhaiihefopfinhjaghfce |
|---|---|
| Version: | 2.0 |
| File size: | 49.63KiB |